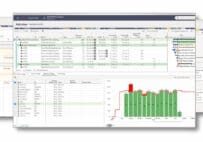
What is that Red Progress Line in Primavera P6?

By: Trey Miller, PMP, PMI-SP
Primavera P6 Professional is one of the most robust project management tools in the market, enabling project managers to plan, schedule, and control large-scale projects. Among its many features, the Progress Line is an underutilized yet powerful visual tool that provides instant insight into project performance. In this article, we will break down what the progress line is, how Primavera P6 Professional works, why you should use it, and step-by-step instructions on how to implement it effectively.
About the Progress Line in P6
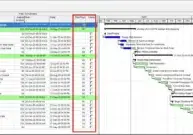
The Progress Line is a visual indicator that overlays on your Gantt Chart to show variances between planned dates and actual or forecasted progress. It helps you quickly identify activities that are ahead, behind, or on schedule.
Key Features of the Progress Line:
- Toggle to display/hide the progress line.

- Shows variance directly on the Gantt chart.
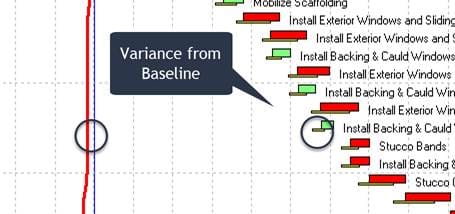
- Highlights deviations from the baseline.
- Easy to interpret for both technical and non-technical stakeholders.
- Works in conjunction with baseline and current schedule data.
Why Use the Progress Line?
- Instant Visibility: Get a clear picture of which activities are on track, ahead, or behind.
- Improved Communication: Easier to explain the schedule status to executives, stakeholders, and team members.
- Faster Decision Making: Quickly identify problem areas and take corrective action.
- Integrated with Baselines: Compare against any assigned baseline for meaningful analysis.
How to Enable and Configure the Progress Line
Step 1: Open Your Project
Load your desired project in P6 and navigate to the Gantt Chart view.
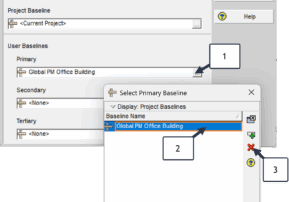
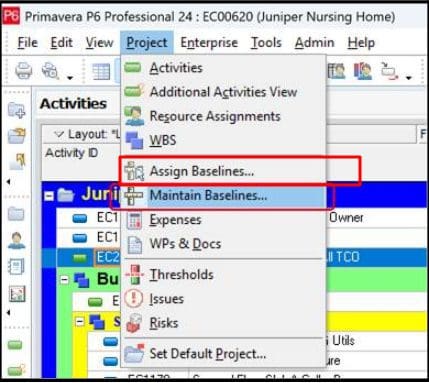
Step 2: Assign a Baseline
Before enabling the Progress Line, ensure you have a baseline assigned:
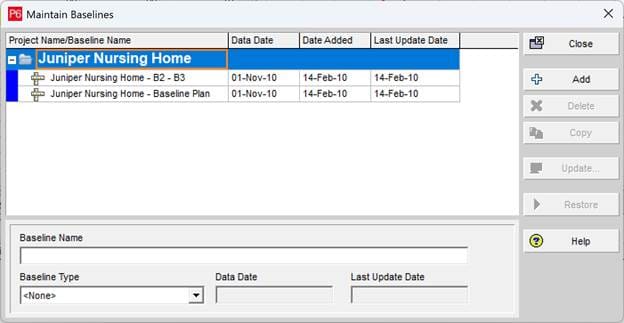
- Create a Baseline Project > Maintain Baselines
- Go to Project > Assign Baselines.
- Choose the baseline you want to compare against.

Step 3: Enable Progress Line
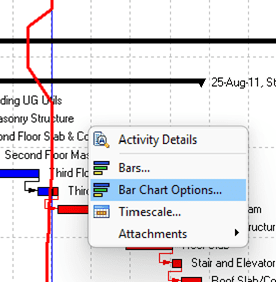
- Right-click anywhere on the Gantt Chart.
- Choose Bar Chart Options.
- Select the Progress Line tab.
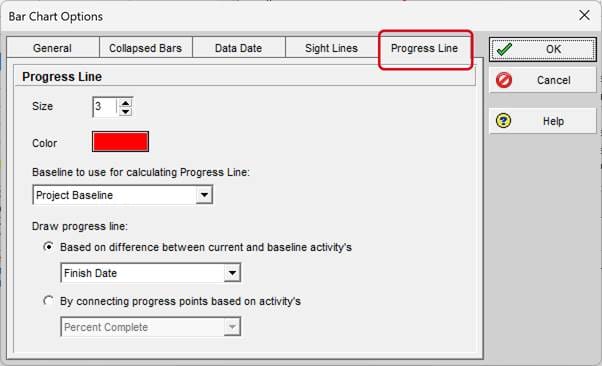
Step 4: Customize Display
You can customize:
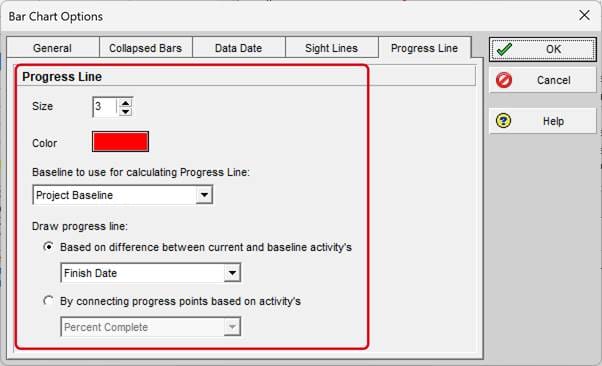
- The data source (Actual, Forecast, or Baseline)
- The color and style of the line
- The calculation basis (Start Date, Finish Date, % Complete)
Step 5: Interpret the Progress Line
- The line will "zig-zag" across the Gantt chart.
- Activities ahead of schedule will show the line to the left.
- Activities behind schedule will show the line to the right.
- Activities on schedule will intersect the planned dates.

Best Practices for Using the Progress Line
- Always assign the correct baseline before activating.
- Use the Progress Line in combination with other tools like the Tracking Layout and Earned Value Analysis.
- Regularly update actuals to get meaningful variance data.
- Customize colors to make variance instantly visible.
Common Mistakes to Avoid
- Do not assign a baseline before enabling the Progress Line.
- Forgetting to update progress, which renders the Progress Line misleading.
- Over-relying on the Progress Line without checking other scheduling indicators.
Final Thoughts
The Progress Line is a simple yet powerful visual feature that helps project managers and stakeholders monitor project health efficiently. By using it properly, you can improve communication, spot problems early, and keep your projects on track.
We're Here to Help!
Need a little help? Contact us today for expert assistance tailored to your project’s needs!


