Using AI to Simplify Primavera P6 Variance Reports
For project managers, one of the most valuable insights from a Primavera P6 schedule is variance — the difference between planned and actual performance. Variance shows whether a project is ahead or behind schedule and by how much. A negative variance usually means you’re behind schedule, but unfortunately, interpreting variance data in Primavera P6 can be difficult, especially for those who don’t use the tool daily.
Fortunately, artificial intelligence (AI) can simplify this task. With a few easy steps, you can export your Primavera P6 schedule and baseline, then use a tool like Claude.ai to automatically generate a variance report in plain English — even with charts or tables that resemble a Power BI dashboard.
Leveraging AI for Efficient Variance Analysis in Primavera P6
Step 1: Export Your Current Schedule and Baseline
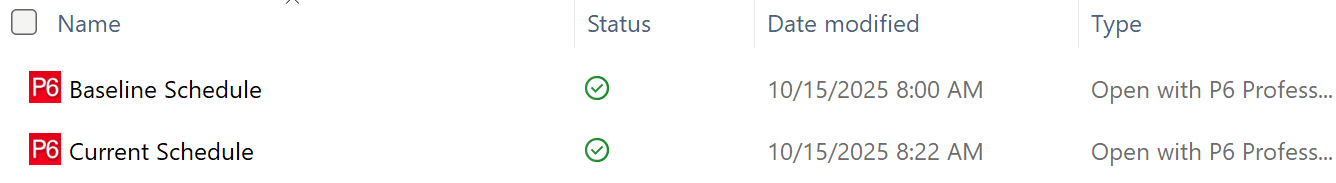
Before using AI, you’ll need two XER files — one for your current schedule and one for your baseline.
- Open your project in Primavera P6 Professional.
- Click Project → Maintain Baselines.
- Highlight the baseline you want to use and click Restore (this temporarily converts the baseline into a separate project file).
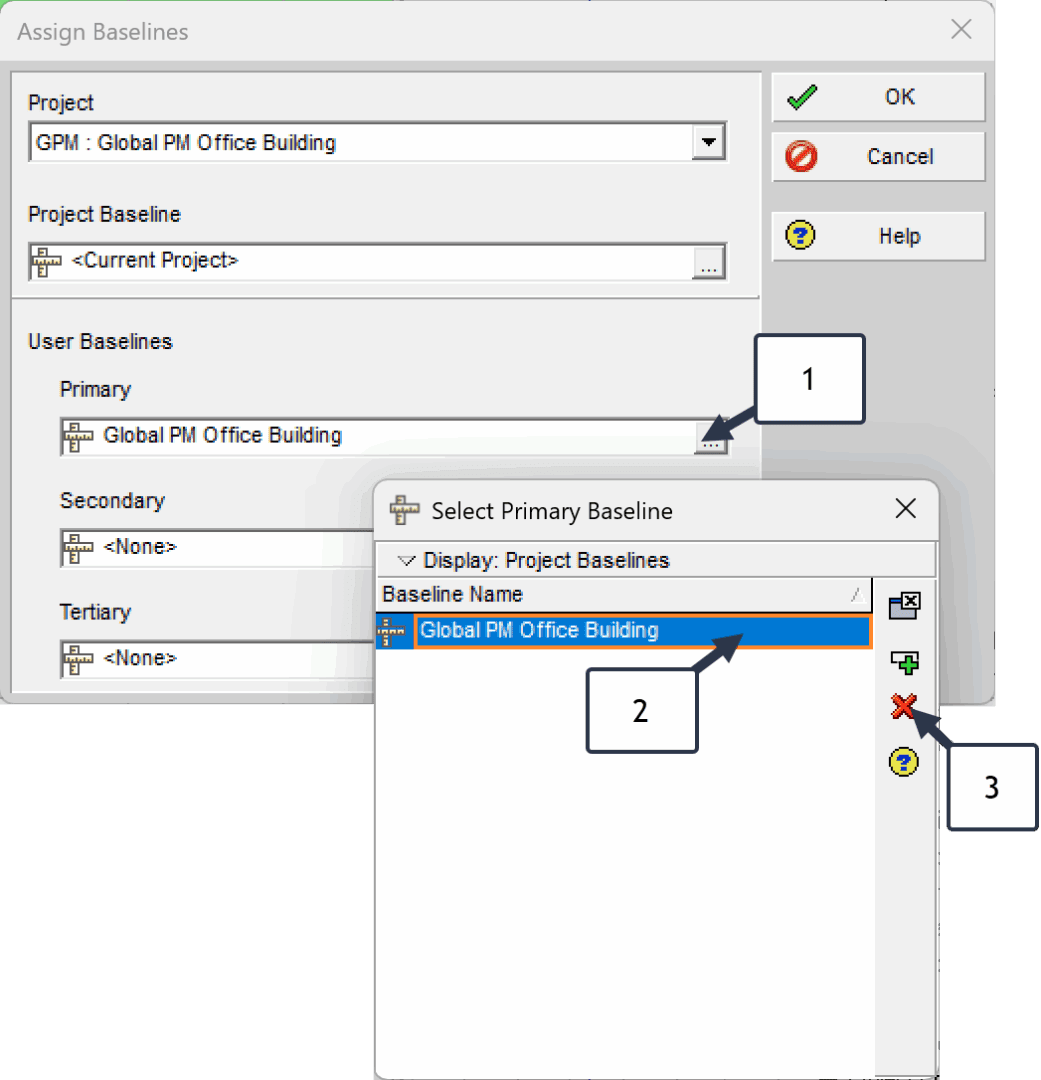
- If the baseline is currently assigned, you will need to “un-assign it.
- Project → Assign Baselines

- Project → Assign Baselines
- Go to File → Export → Primavera XER, and export both:
- Your current schedule (e.g., Current Schedule.xer)
- Your baseline project (e.g., Baseline Schedule.xer)

- After exporting, you can reassign the baseline to the project if needed.
Step 2: Prepare the Files for AI Analysis
You’ll now have two .XER files — one representing your current schedule and one representing your baseline. These are text-based data files containing all project details: activities, durations, start/finish dates, relationships, and more.
Claude.ai (and similar AI tools) can interpret the structure of these files and calculate differences — for example, which activities started late, which are ahead, or where float values have shifted.
Step 3: Use Claude.ai to Generate a Variance Report
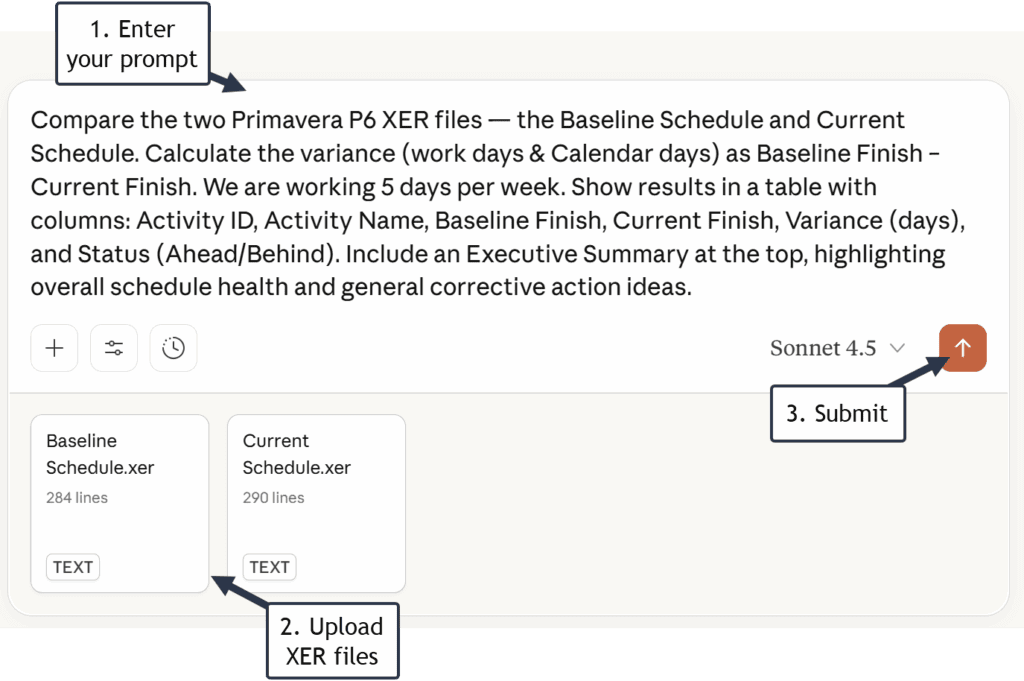
Once both files are ready, open your Claude.ai workspace, enter a prompt and upload the two XER files.
Note: The example prompt provided in this article is intended only as a simple demonstration based on a sample project. When using A.I. with your own Primavera P6 data, you should tailor the prompt to fit the specific structure, naming conventions, and reporting needs of your project to ensure accurate and meaningful results.
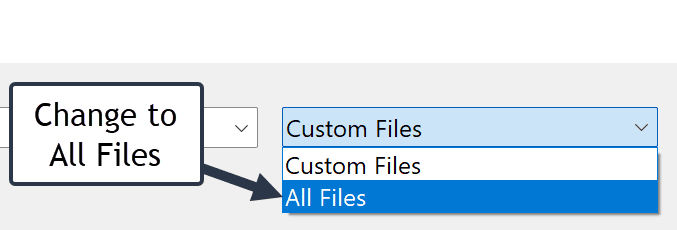
Note referencing Step 2. You will need to change the File Type drop-down to All Files to locate XER files.
Step 4: Wait

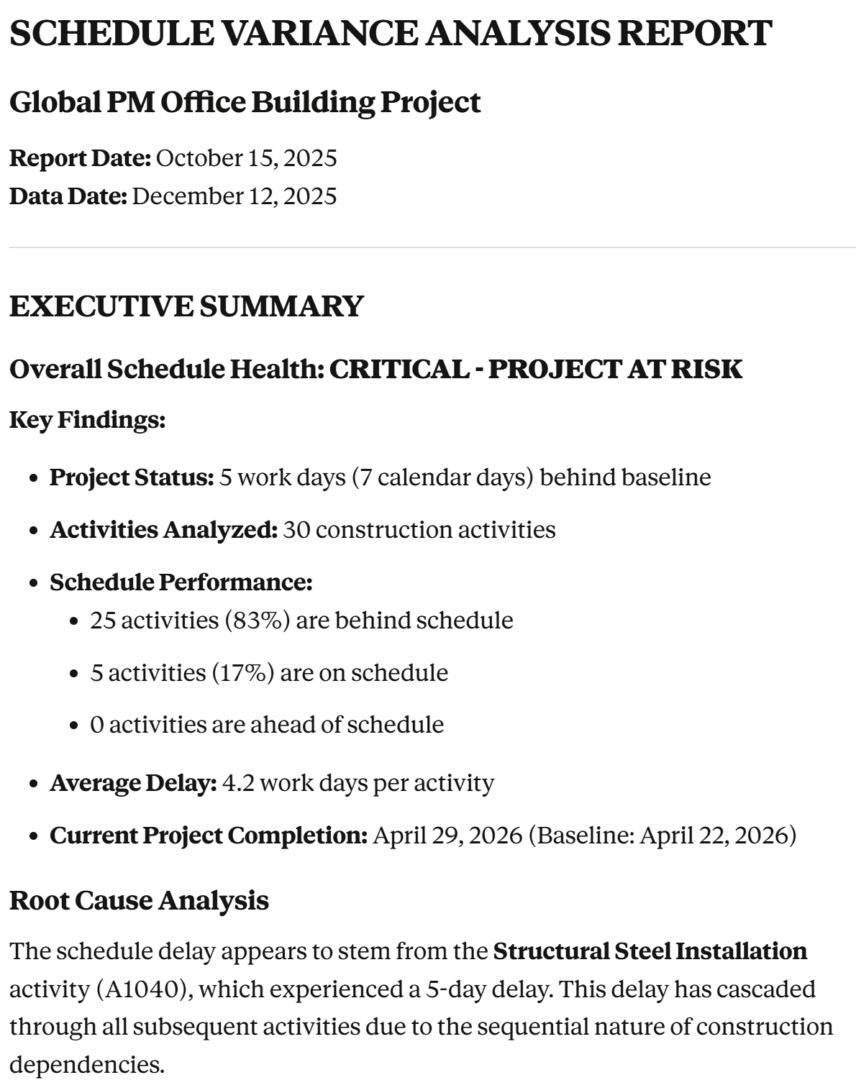
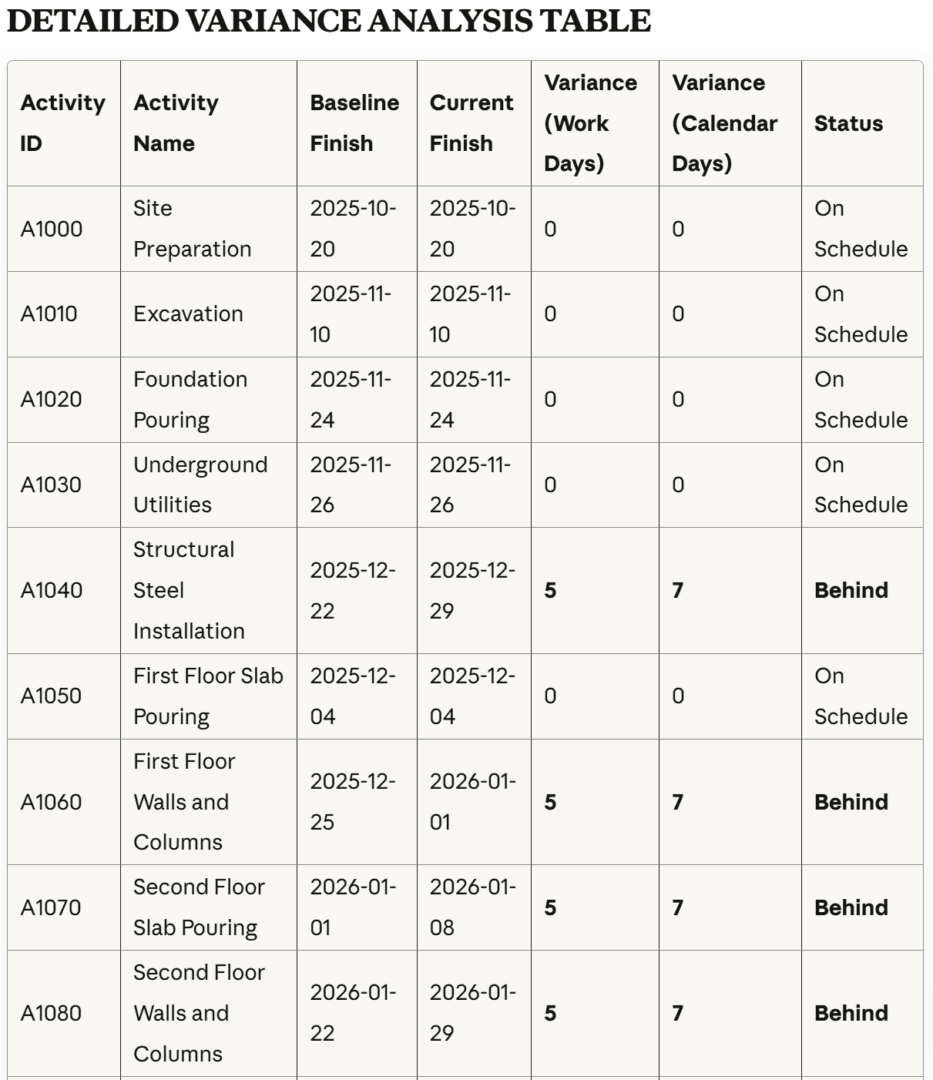
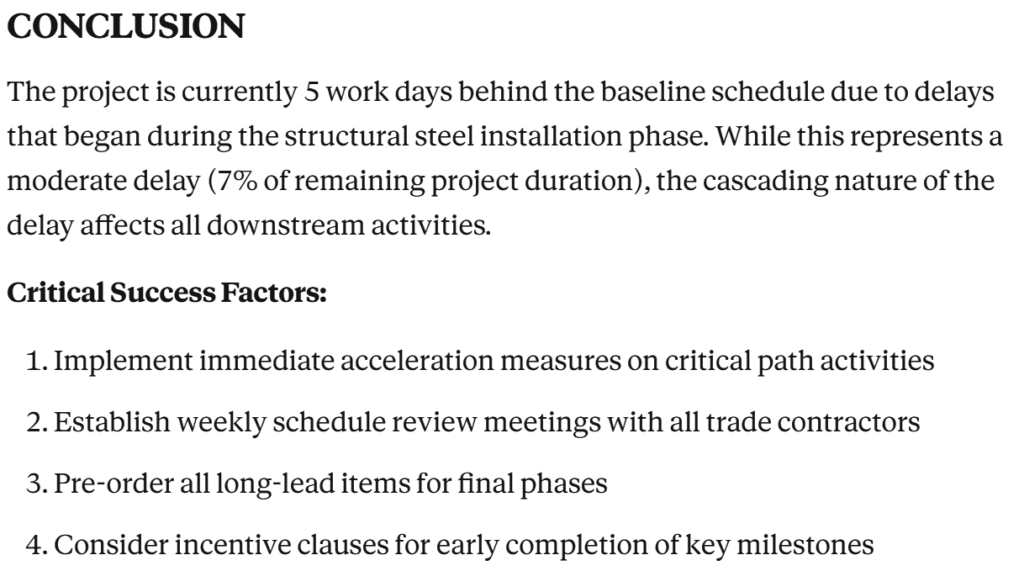
Step 5: Thoroughly Review the Output (See A few snippets below)
- “Trust but Verify.” - Ronald Reagan